Main Window Toolbar and Menu Bar
The main window has both a menu bar and a toolbar. Together they provide
quick access to the functions of Performance Manager. The menu bar contains the
following items, which are tear-off menus. If you click the underscored letter
in each item, that menu will "tear off" and display separately.
Menus and Menu Commands
File

New Session
- Clicking this link displays information on sessions.
Open Session
- Clicking this link displays information on sessions.
Save Session
- Clicking this link displays information on sessions.
Save Session As
- Clicking this link displays information on sessions.
Exit
- Clicking "Exit" quits the session.
View

Toolbar
- Selects the toolbar for display.
Nodes
- Selects the node area for display.
Work Area
- Selects the work area for display.
Messages
- Selects the message area for display.
Options

Enable Tool Bar Label
- Displays a label as the cursor passes over each toolbar icon.
Tasks

Node Management
- Provides access to the controls for adding, deleting, and moving
nodes and clusters.
Category Management
- Metric categories can be made visible or hidden. Visible
categories are selectable for monitoring.
Threshold Notifications
- Presents a list of activity with a reporting window.
-
Commands

Configure
- The Configure dialog box
integrates your commands with Performance Manager.
Move
- This dialog enables you to regroup commands in different categories.
Command Category Mgmt
- This dialog enables you to add or delete command categories.
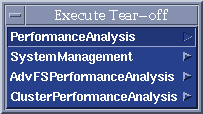
Execute

Performance Analysis
- These commands detect performance problems and offer corrective
advice in four areas: CPU, memory, network, and disk I/O.
System Management
- These commands perform tasks on the node they are executing on.
Cluster Performance Analysis
- These commands analysis cluster performance.
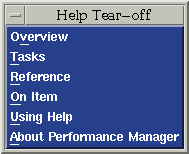
Help
Overview 
- Clicking Overview opens the first window of the help volume. From this
scroll box you can navigate to any topic.
Tasks
- Clicking Tasks opens the Using Performance Manager section of the help
volume. From this scroll box you can navigate to any topic.
Reference
- Clicking Reference opens a section of the help volume with more information
about the functions of Performance Manager than is available from ON Item.
On Item
- Clicking On Item changes the cursor to a question mark. Placing the
question mark on an area of the GUI and clicking opens a help window with
specific information.
Using Help
- Clicking Using Help opens the CDE help volume, which explains how the help
system works.
About Performance Manager
- Clicking About Performance Manager opens the help window containing
information about this software version, copyrights, and trademarks.
Toolbar Icons
The toolbar icons are arranged by groups and represent these actions:
File Group
 New Session
- Clicking this link displays information on sessions.
 Open Session
- Clicking this link displays information on sessions.
 Save Session As
- Clicking this link displays information on sessions.
Task Group
 Node Management
- Provides access to the controls for adding, deleting, and moving
nodes and clusters.
 Category Management
- Metric categories can be made visible or hidden. Visible
categories are selectable for monitoring.
 Threshold Notification
- Presents a list of activity with a reporting window.
Command Group
 Configure
Command
- The Configure dialog box
integrates your commands with Performance Manager.
 Move Command
- This dialog enables you to regroup commands in different categories.
 Command
Category Management
- This dialog enables you to add or delete command categories.
Help
 On-Item Help
- Clicking On Item changes the cursor to a question mark. Placing the
question mark on an area of the GUI and clicking opens a help window with
specific information.
 Overview Help
- Clicking Overview opens the first window of the help volume. From this
scroll box you can navigate to any topic.
On-Item Help
Overview Help